I picked the first 2 options by imagining a quadratic such that the discriminant would be equal to a -ve number and 0 respectively. Does that work?
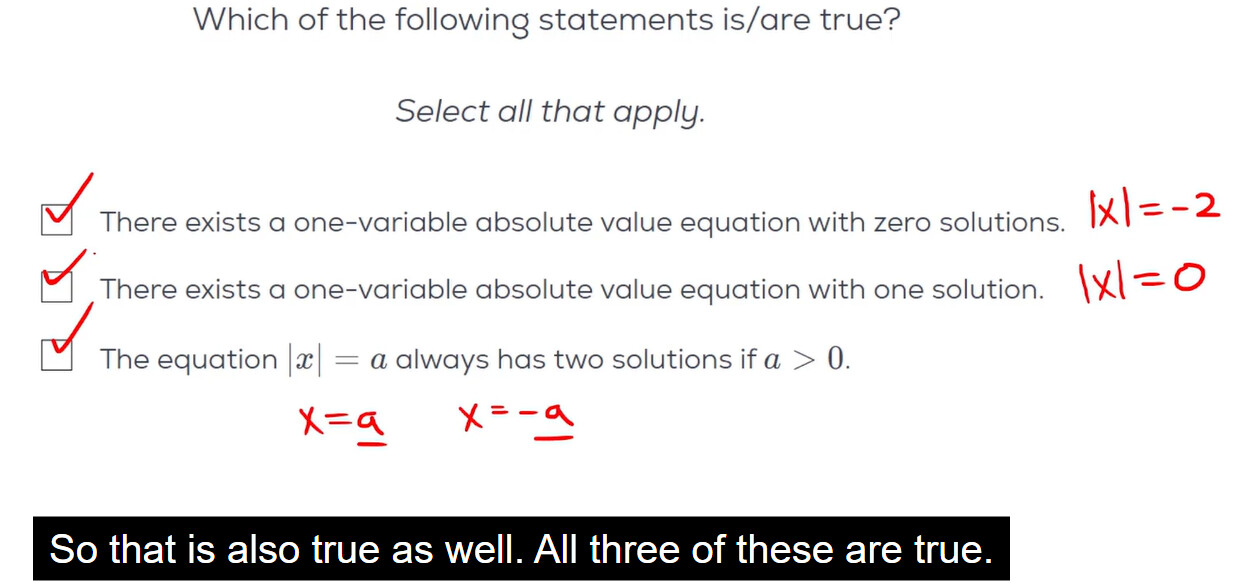
A “quadratic” is different from an absolute value function, so you haven’t really answered the question.
I meant I thought if I had a quadratic equation, of which I take the absolute value. I can still have a discriminant which is -ve in 1 case and 0 in another case. However, I did not choose any numbers of try to solve for it. Is this thinking correct?
Yes, that indeed works, but I would argue you’re missing the “fundamentals” here. It might again help to think of these questions graphically with the fundamental concept in mind.
Oh okay. Would you be able to help with the graphing for this one? And if you could share the website link where you do the graphic, I’ll play around and use it for future questions
You can use Desmos/Geogebra
Thanks!
I’m just trying to understand how I would have to interpret this graph:
i. |x|=0 is just 1 line along the y axis, so that would give me only 1 solution for x in every situation.
ii. |x|=-2 has no solutions thus nothing showed up on the graph.
iii. |x|=a (or |x|=y on our grapher) has a symmetrical graph across +ve and -ve values for x, and has no negative values for y. Indicating that y can’t be negative,
and for y=-4 we will have |x|=4, for y=4 we will also have |x|=4
Is this understanding correct?
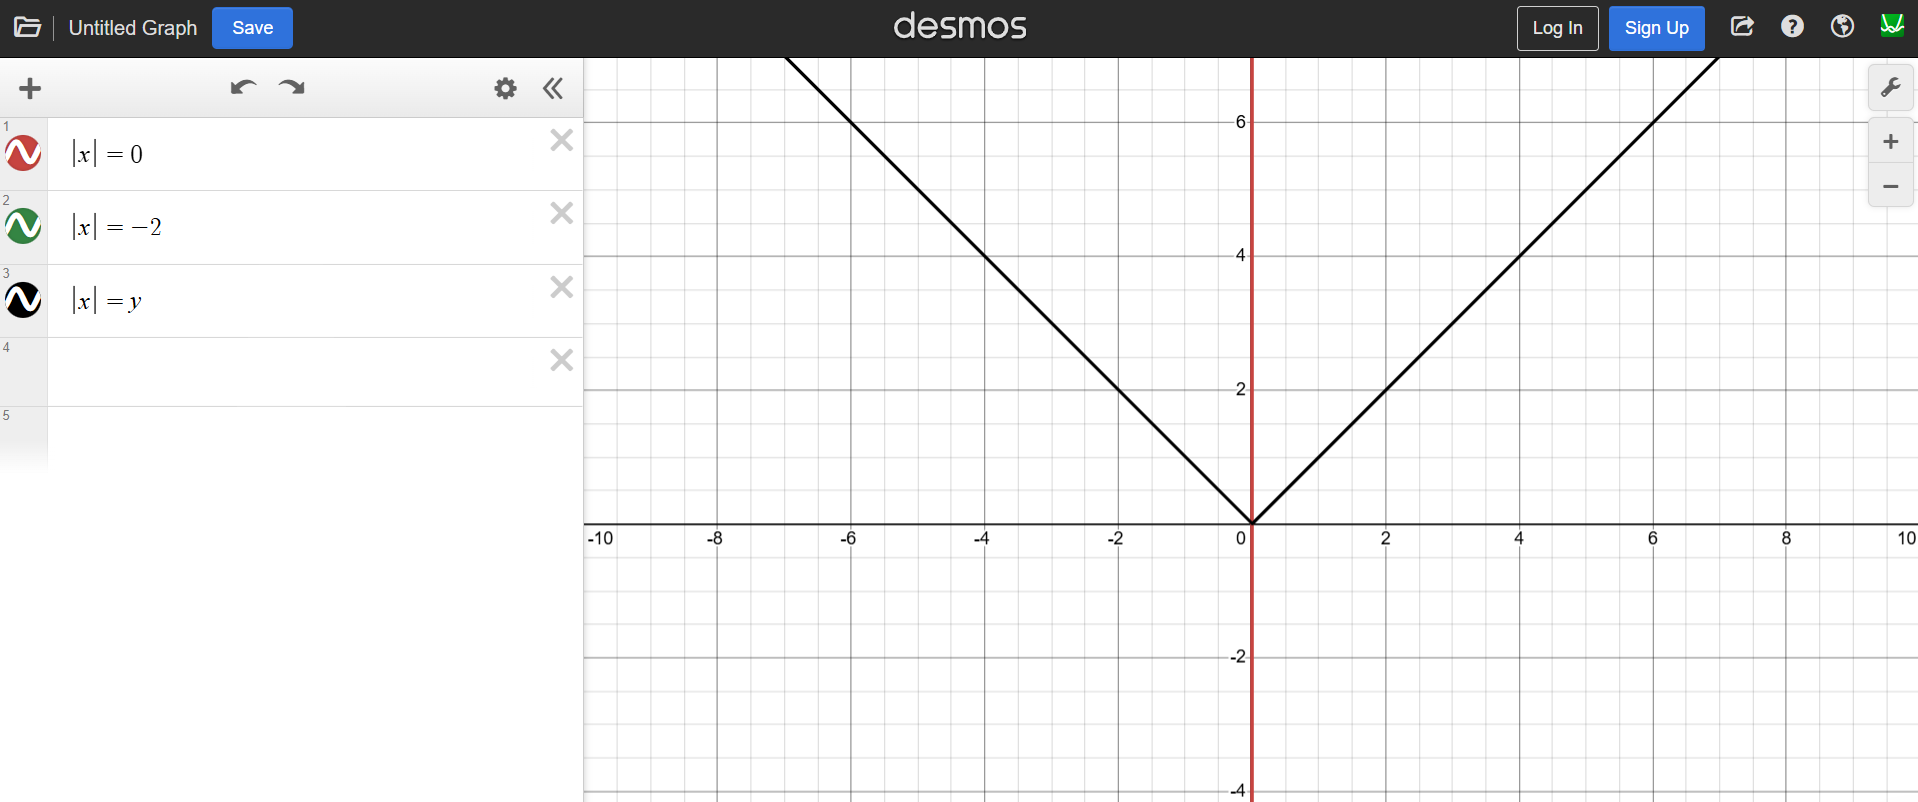
You’re supposed to separately graph the left-hand side and the right-hand side of the equation. The way you graphed it, you ended up showing the solution space/set.
For instance, graphing |x| = 0 would just show you the line x = 0, which is the red line you see. It’s the only value of x that satisfies the equation you plotted, so you don’t see anything else. Similarly, |x| = -2 shows nothing because there are no real values of x for which |x| equals -2.
Here’s the actual graph you’d find helpful to solve the problem.
Slide the values of a from positive to zero to negative. You’ll notice the horizontal line g(x) intersect the graph f(x) first in two points, then in one point (a = 0), and finally in no points.
Oh yeah that makes sense. Thanks! So will I have to graph the LHS and RHS as separate functions for each of my 3 options? Or this is just when x/|x| is equal to a variable?
Well, you can play around with the desmos link i provided. That is mostly all you need.
Cool thanks!