In the graph does the existing home calculated after subtracting the new sales?

In these two question how is B and C the right ans

In these two question how is B and C the right ans
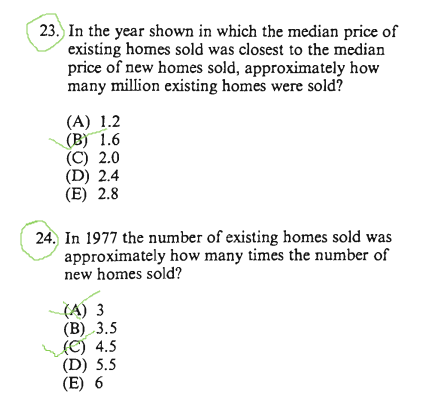
For 23.
I admit it’s pretty close
There are 2 years that are close contenders, 1970 and 1980
Because the big book is based on older material you would literally have to measure the bars to see the exact values and calculate which is closer.
But visually we can pretty much see that the difference between the two bars in 1970 is the least.
I’m working with 22 (exisiting) and 23(new) from what I can see
Whereas for 1980, I’m working with 61 and 63 respectively
23 and 23 are closer than 61 and 63 (i.e difference between 22 and 23 is less than 61 and 63)
Hence 1970 is the correct year, and ~1.6 is the correct number of existing homes
For 24.
In 1977,
Number of existing homes is a little over ~ 3.5
Number of New homes is a little over ~0.75
Hence the correct answer is the option closest to 3.5/0.75
Therefore option C