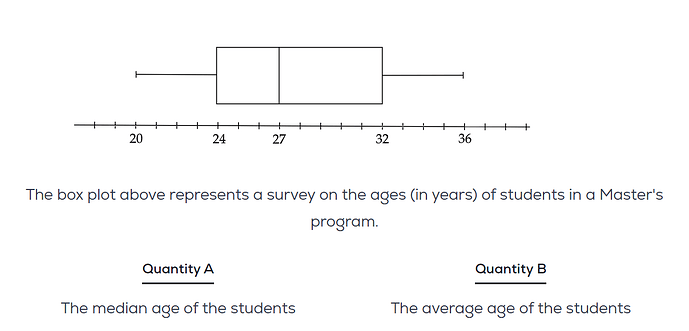
I came across this question on the Data Analysis Fundamentals Quiz #2.
Answer according to Greg: “D”
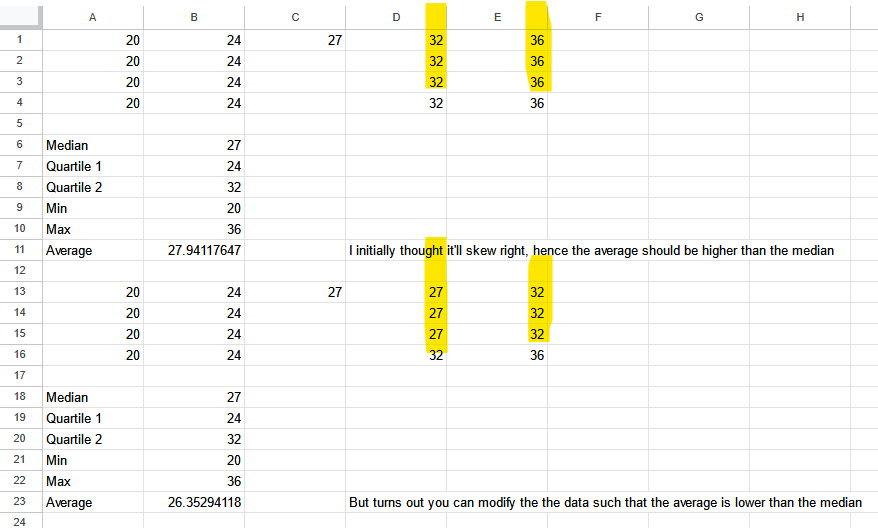
However, I agree that we cannot find the actual value for mean but we can figure out the relationship between the median and mean. Because, the box and whisker plot clearly tells the skewness of the data.
For example, in the question - median is at 27 which is on the left side of the box indicative of half of the values being in the range of 20-27. and half of the values in the range of 27-36. Thus the higher 50% of the values are spread more. Therefore, the data is positively skewed and hence mean > median.
Please let me know if my understanding is correct. Or am I missing something?


