I found this question when going through the “No Math Needed” strategy video homework (week 5 day 5, answer solved in the day 6 video by Greg) of the Two-Month Study Plan.
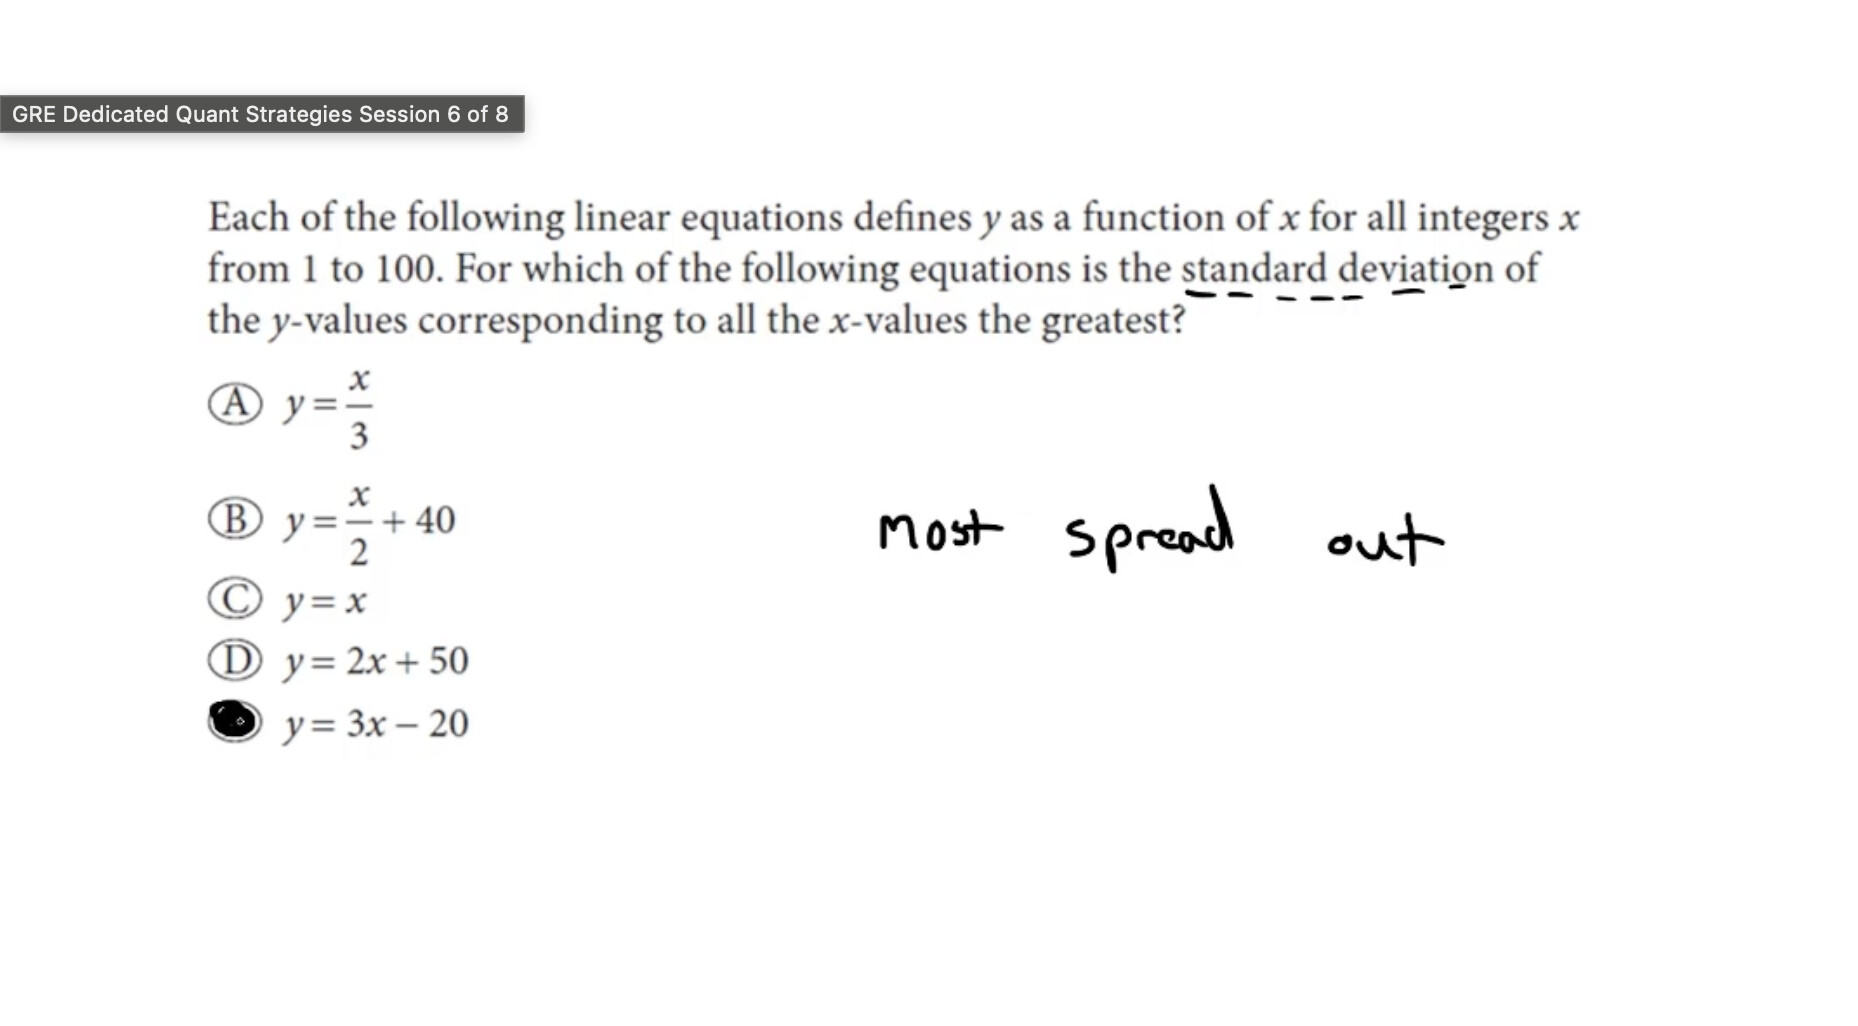
While I understand one can get the answer by simply choosing numbers or by knowing that “y=3x-20” is going to be much more spread out than the rest of the options, I found myself wondering how it pertains to the slope of a normal distribution curve. Based on the coordinate geometry concepts, the higher the “m” in y=mx+c, the steeper the slope. But in a normal distribution curve a steeper slope = a smaller standard deviation, right? So, from a concept stand-point why would a greater “m” or slope value give a higher standard deviation?
I like that you’re trying to connect these concepts.
For the question pictured, notice it’s asking for the SD of the y values, and in a normal distribution, the SD is of the x-values, which explains the contradiction you mention.
I see where I was going wrong. Would you say that I cannot really look at this question from a normal distribution perspective? Because my understanding is that if we were to create a normal distribution curve for y-axis with respect to x values to see the rise over run we would see a correlation with the increasing slope and greater standard deviation.
If we were to plot these values the corresponding y mean value becomes (3 * 50.5 - 20) which is 131.5 creating a great spread of data with other values. But if we were to look at this curve from the x-axis perspective, we would notice each y-value being much greater for its corresponding value, and hence the slope being much steeper.
It seems like the linear regression line informs the normal distribution curve? If so, the m value would inform the linear equation on the graph, which in turn positively correlates with the great spread of data on the normal distribution curve for the y values.