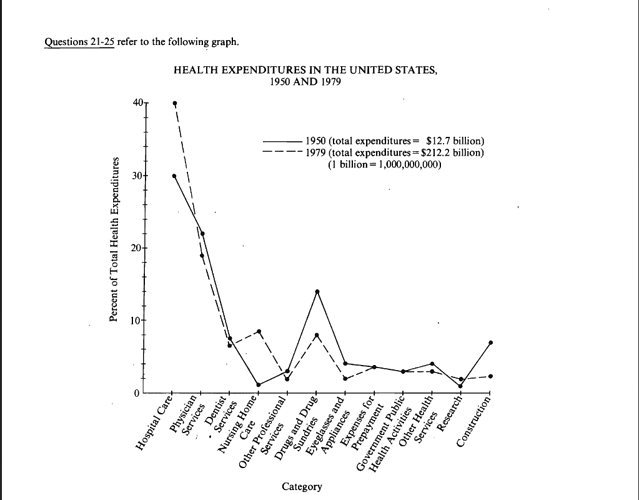
I got the following question wrong:
Which of the following can be inferred from the
graph?
I. The number of patients needing hospital
care increased from 1950 to 1979.
II. The dollar amount of health expenditures
for construction was greater in 1979 than
in 1950.
III. In 1979 the dollar amount of health expen-
ditures for dentist services was more than half
the dollar amount of health expenditures for
physician services.
(A) I only (B) II only (e) III only
(D) I and II (E) II and III
Apparently the correct choice is B. I’m confused as to how I is false. The respective percentages for hospital care in 1950 and 1979 are 30% and 40%, and the total expenditure is much higher in 1979 so wouldnt this make the hospital care expenditures much greater in 1979 making I true?
