Somehow I got these rather rudimentary questions wrong but it’s also because it’s a pretty tedious process to go through under time pressure + the need to gauge the chart / approximate numbers from the graph. Does anyone have good advice on how to do approach these better?

For 21, I put my answer as A but the real answer is D (with hindsight, I think calculating the boxes are easier)
For 24, I put my answer as C but the real answer is B (tedious - how do this better rather than brute force it?)
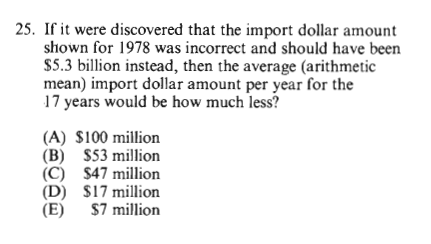
For 25, I put my answer as E but the real answer is A (tedious - how to do this better rather than brute force it?)
Also, does gregmat made any walkthrough solution for these big book questions for quant? Want to practice more data questions from the big book given its significance in quant.
Any tips on better solving these questions? Feels like these data questions are like TC equivalent
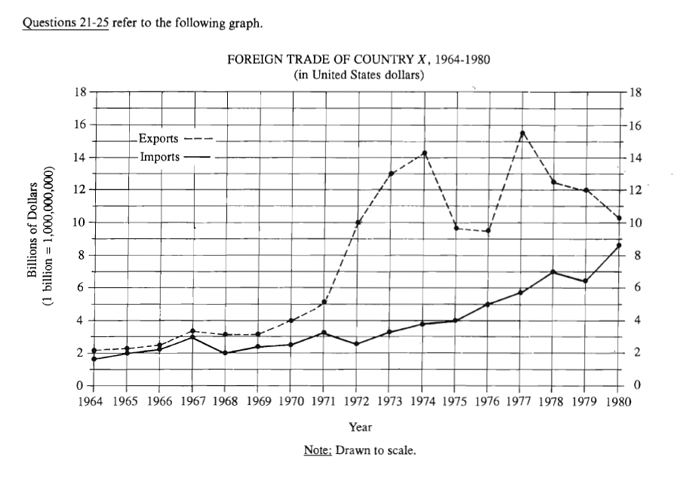
For the first question you really only need to look at two years - 1972 and 1977. This is just two quick calculations to discover that 1977 had a greater jump in exports from the previous year. 1971 was 5b, 1972 was 10b, which is a 5b jump. 1976 was 9.5b and 1977 was 15.5b, which is 6b jump. So, 1977 is the answer. As Greg says “EZ PZ.”
For the second question you’re looking at 1972, 1973, 1974, 1975, 1977, 1978, and 1979 for a total of 7 years. If you start with 1972 you can count the boxes between to see that it’s almost 7b. 1973 and 1974 are clearly bigger than this so you can add those without counting boxes. Count boxes for 1975. It’s just over and you can see the next year is smaller so don’t count that year. Then move on to 1977 and 1978. 1977 clearly has a greater than 5b jump, then count boxes for 1978 and 1979. This might seem tedious, but you’re really only counting boxes for four years. All the other years outside this range are clearly less than 5b.
For the last question ETS wants you to fall into the trap of adding up all the years with the new 5.3b total for 1978 and then finding the new average. You’ll waste so much time doing this. The simplest thing to do is find the difference between the incorrect amount and the 5.3b amount. In this case that would be 7b and 5.3b, so the different is 1.7b. Divide that by the total number of years - 17, to get 100m.
Hope this helps.
1 Like
Piece by piece helps, and you can make good use of the Big Book to practice charts.
1 Like
Thanks a lot! That’s a good trick to quickly calculate the difference of a new mean. Really appreciate time taken to answer my queries. I have to practice more with these data questions - easy but requires attentiveness to slay them. I realized I keep making careless mistakes because I don’t read the questions and graphs properly.


