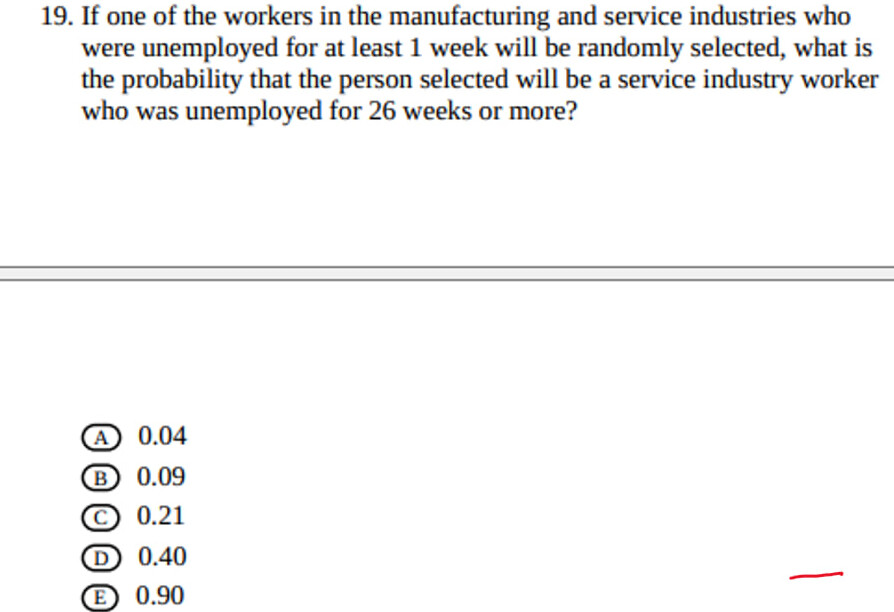
I don’t understand how to approach this question.
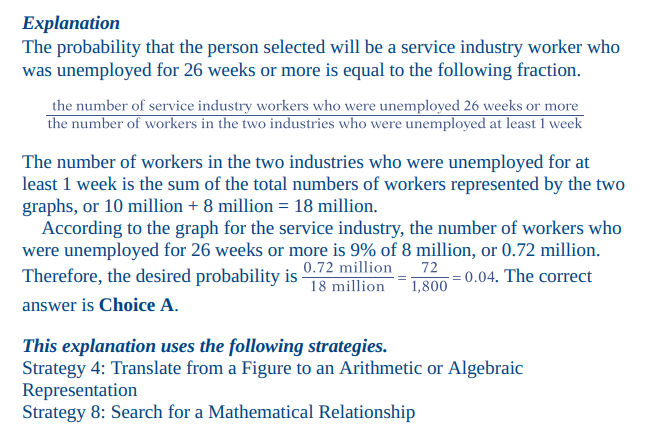
Any ideas for a different solution from the Ans Sheet.
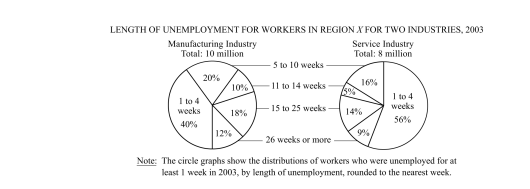
This is a chart question - where’s the chart? Also what ideas do you have (if any - doesn’t have to be correct)?
What does the “median” mean in this context?
The median means here is that if we list the total no of workers by their exact week unemployed in order then what is the median of those!
In other words, the 50th percentile. Use that to your advantage.