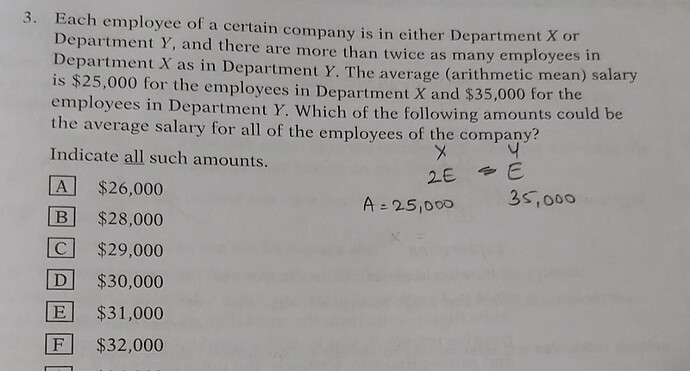
Over here I followed the Soln using Weighted Average method but how wud we recognize that its a weighted average sum
I though I would substitute some values and check it out
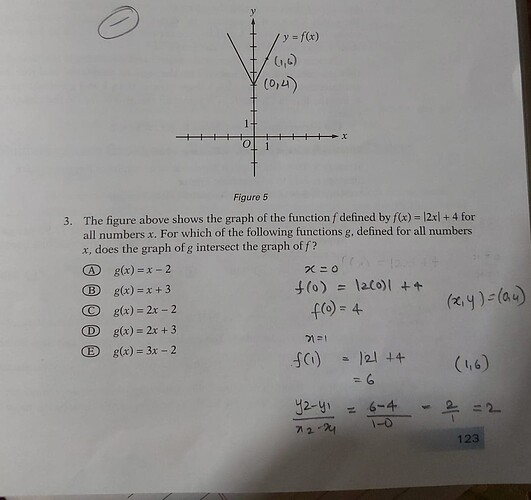
Over here shud I check the graph value for each option. Wudnt that be too time consuming?
How is C correct?
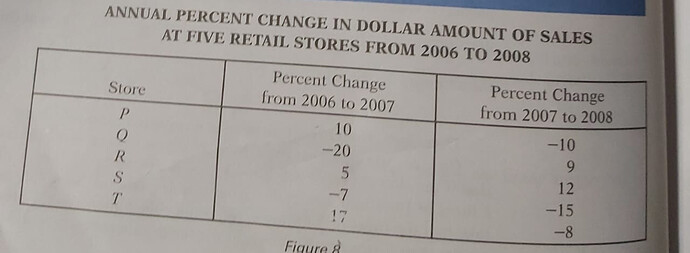
I am confused abt 2007 and 2008 dollar amt ?
Is there any other approach for these problems?
Because the number of employees in Department X and Y aren’t the same, so the weighing cannot be the same either.
I don’t think that would be too time-consuming.
Alternatively, use reasoning. For example, can C and D ever intersect the graph (you may want to try this on Desmos)?
1.12 \times 1.05 > 1.17
?
1.12 × 1.05 > 1.17
Cud u explain this?
The dollar amount of 2007 would be X1.17 and for 2008 X1.25?
@Leaderboard
Let x be the dollar amount for store R in 2006.
In 2007, this is (1.05 \times x), as there is a 5% increase.
In 2008, there is a 12% increase on 2007 levels, that is, (1.12 \times (1.05 \times x)).
No, it would be 1.17x and (0.92)(1.17)x. It’s reducing, not increasing.


