Hi everyone,
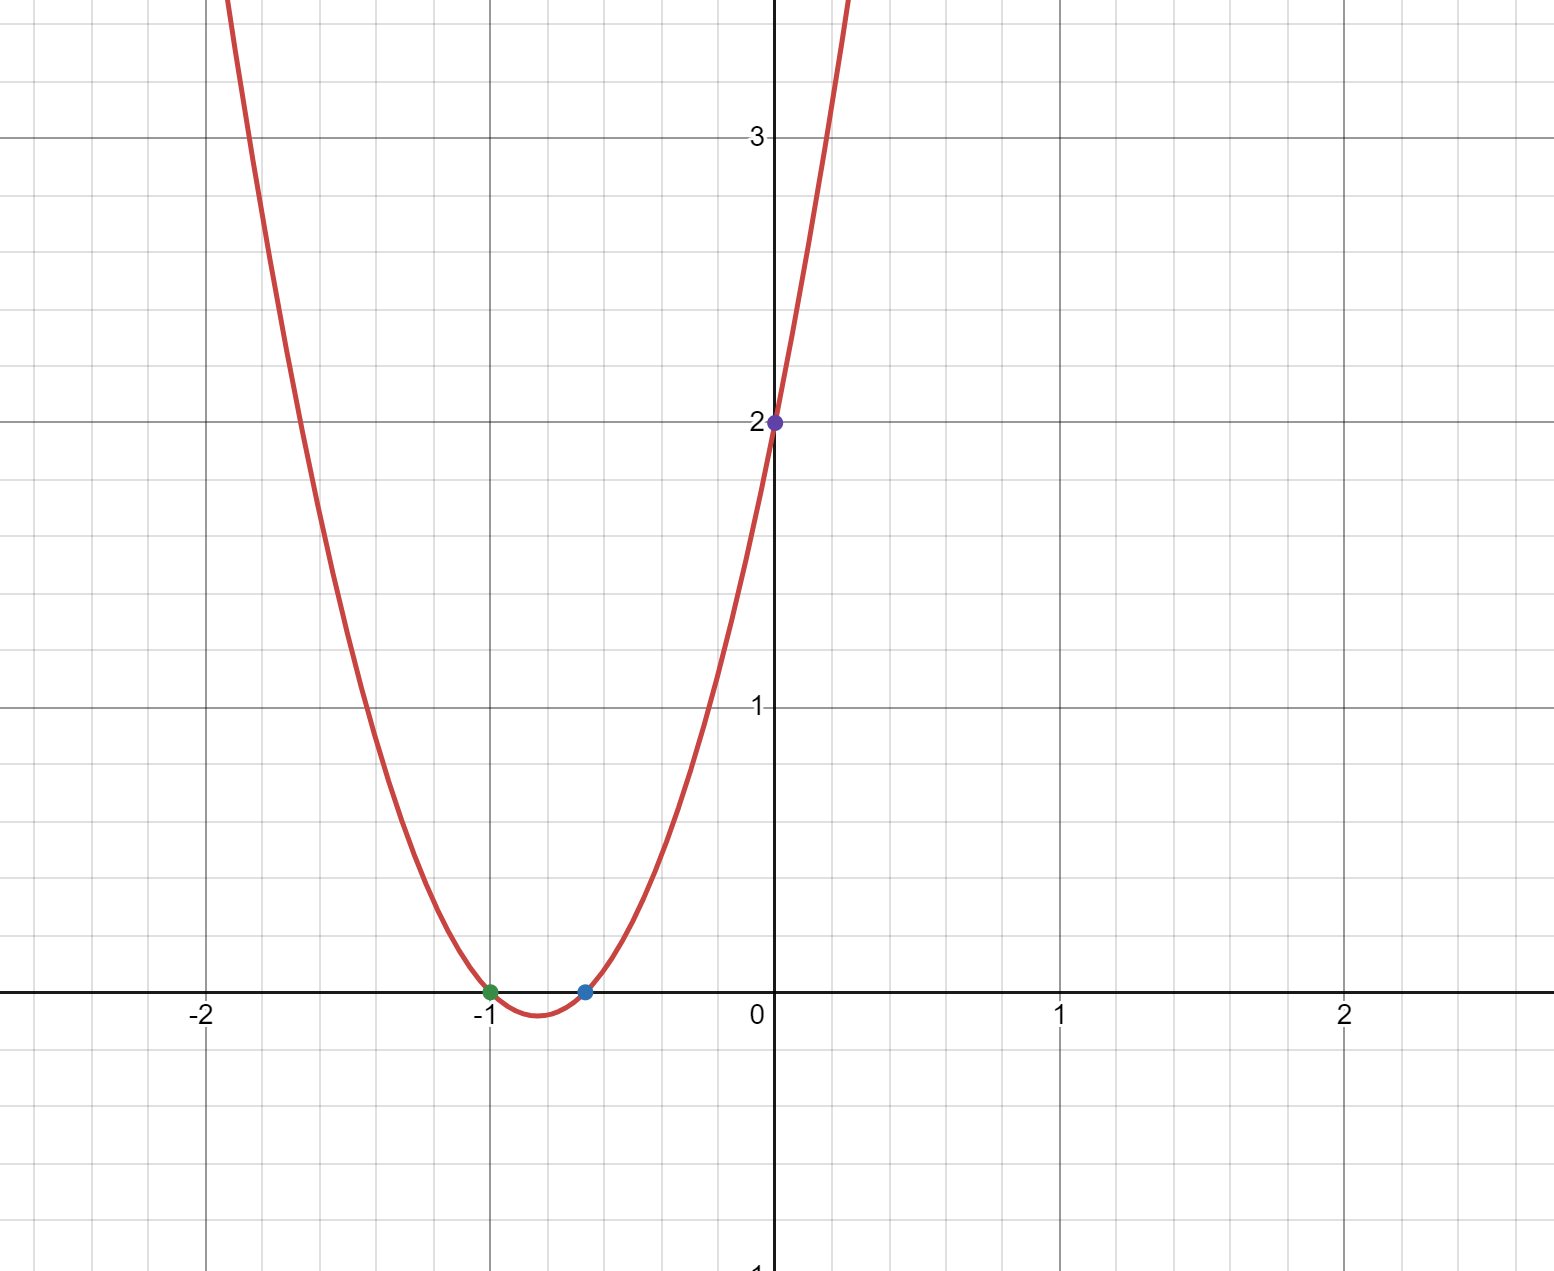
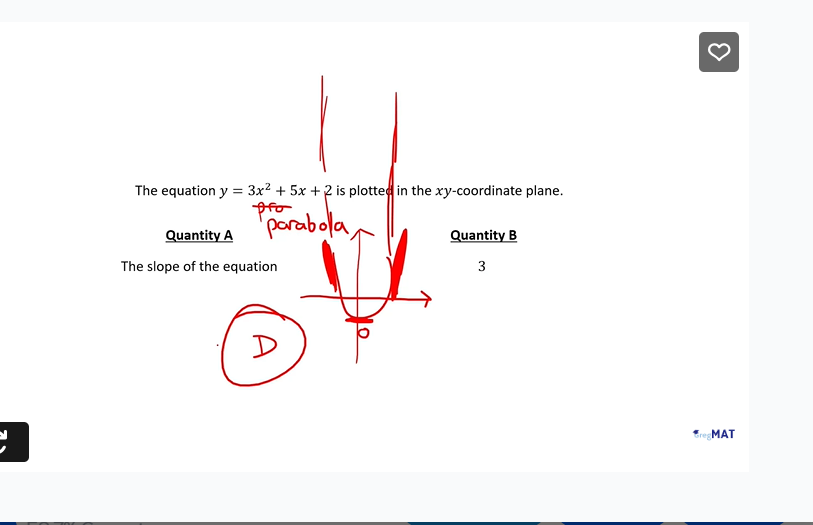
Can someone tell me how the graph is in the negative quadrant. The y-intercept is 2 which should be in the + quadrant and above 0, not below the (0,0)?
Hi everyone,
Can someone tell me how the graph is in the negative quadrant. The y-intercept is 2 which should be in the + quadrant and above 0, not below the (0,0)?