Can somebody explain to me why is the answer C ?
Ideally, the percentile is a ranking, so the 30th percentile measured length can be for any number of bees right?
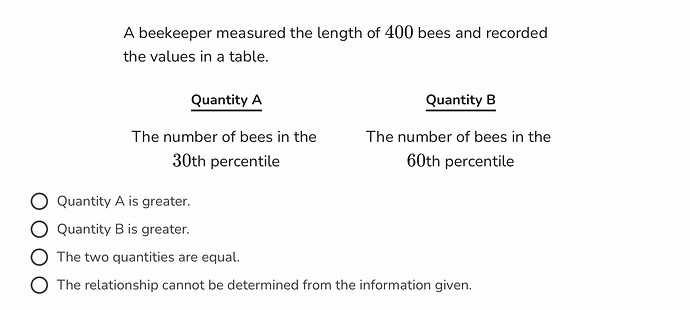
It is a percentile measure. So Quantity A is asking how many bees would have their lengths in the 30th percentile, while Quantity B is asking how many of them would be in the 60th percentile. Considering that there are 400 bees in total, there are about 4 bees in each percentile. Hence the answer is intended to be C.
Is this the case for all percentile problems?
In other words, if the number of members for one percentile is given, can we assume the total number of members considered would be 100 times the value given? Are there any constraints to this?
In general. The exception is if the distribution is unusual - for instance, the heights of all the bees happen to be the same. In that case you actually have only one percentile (usually 0) that covers all bees. This should ideally be mentioned in the question itself, and I’ve flagged that potential ambiguity.
Thank you so much for the detailed explanation. 
Can anyone help explaining this one - problem link
Thanks
400 bees so each percentile will contain \frac{400}{100} = 4 \text{ bees}
Now , as question asked the number of bees in 30 and 60 percentile = 4 , hence C
Ok thanks!.. framing of this question is quite weird. Generally at a given percentile there exists only one number, not a range of them

Welcome to GRE !!
I disagree… going by that analogy, length of bees at 30th and 60th percentile would be different and not 4 (which is the number of bees)
Marks (in the above example) corresponds to the length of bees not the number of bees
Actually that example is not appropriate, because the percentiles are actually different, just rounded to the nearest whole number.
Its asked number of bees.
Now , to understand it more fundamentally :
Take 100 students and each student will have distinctive marks from 1 to 100. → Number of student in 30th percentile.
Now, Increase the number of student to 200 and each student will have marks from 1 to 100. → Again, Number of student in 30th percentile.
According to your reasoning - seems like the question is asking to figure out the number of bees between 30th and 31st percentile and similarly, 60th and 61st percentile → which should be 4 and I agree to that.
To twist our brain a little more so we can get comfortable with this concept, I would recommend you to check out this heinous problem by Manhattan Prep on 5lb : https://greprepclub.com/forum/statistics-the-outcome-of-a-standardized-test-317.html
You are right. This bug has been flagged.
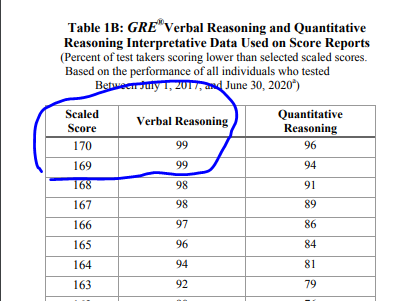
So I was actually wrong from a GRE standpoint. In many cases, such as the data science work I occasionally do, there is a legitimate reason to use finer precision than whole numbers. However, when it comes to ETS, they define percentiles closer to percentiles and z-scores, in other words they group percentiles into whole numbers. This means that all “percentiles” in the region [30, 31) count as the 30th percentile, and as a result the question is correct as it stands from a GRE point of view. In other words, 30.25th percentile is not defined. Sorry about that.
