Should we calculate the SD with the formula? Or can it be done conceptually?
How is it much spaced out u mean wrt the y axis
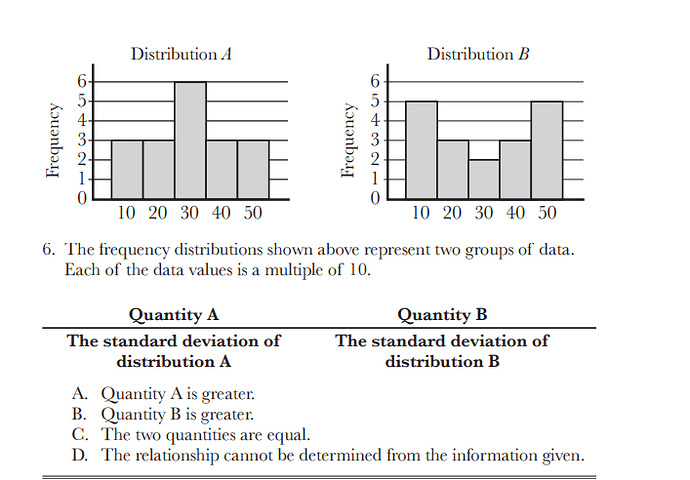
Notice that A is “flatter” than B. This hints at the standard deviation for B being greater than A - standard deviation is a measure of dispersion.
I also thought that graph-B is much spaced out and will have bigger SD, however, I suspect they have the same SD.
Graph A(Mean)= 540/18=30, Graph B(Mean)= 540/18=30, from mean both the graphs have SD=10 as 20 and 40 are 10 distance away from the mean.
Please let me know if my approach was correct, feel free to correct me.
But their frequencies aren’t the same (especially for 10 and 50).
Yes in graph B, 10 and 50 will be occurring for 5-5 times and in graph A 10 and 50 are occurring only for 3 times, since 10 and 50 are occurring more in graph B so their SD will be big? Is this what you meant?
That’s the idea - noting that 10 and 50 are further away from the mean (30).
I am sorry but I didnt follow the pattern recognition here?
Which has lower SD: less values around the mean or more values around the mean?
less values around the mean
No, it’s more values around the mean. That way, you have fewer terms that are away from the mean (which is what SD kind of measures).
Meen! certainly agree.
