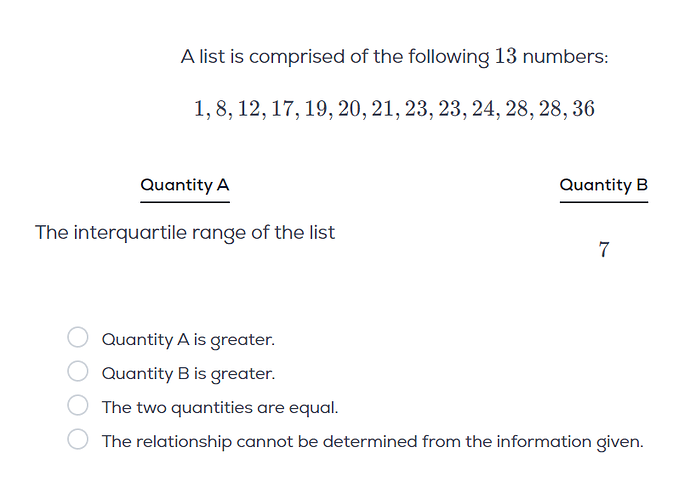
In the video, Greg says the right way to get Q1 and Q3 is to calculate de median of the first half and second half of the data, not including the median. I would have done it differently (including the median), given than the four groups in which Q1, Q2, and Q3 divide the data are stated as L-Q1, Q1-Q2, Q2-Q3 and Q3-G in The Math Review. So the first half of the data would be L-Q2, and the second Q2-G, inclusive. Can anyone explain to me why that is not the case?
Thanks 
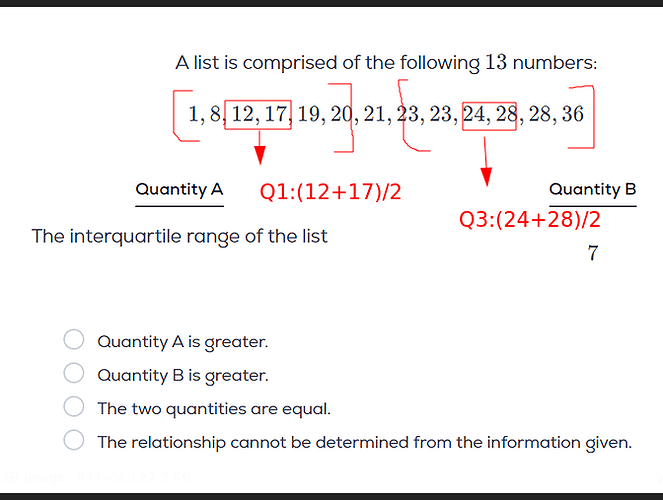
Here number’s are odd hence you can do this :
and for IQR we only need \text{IQR }=Q_3 - Q_1
The example show in Math review is of even numbers hence they included the median too
Thanks! Yes thats how Greg solved it in the video. My question is what is the concept reason behind.
I know the definition of the interquartile range.
My question is about the composition of the 4 groups that devide the data in equal parts. I thought it needed to include the median, but now I see that it did not.
From The Math Review I undertand this:
1st group: [L-Q1]
2nd group: [Q1-Q2/M]
3rd group: [Q2/M-Q3]
4th group: [Q3-G]
From this question I take that rather, they would be:
2nd group: [Q1-Q2/M[
3rd group: ]Q2/M-Q3]
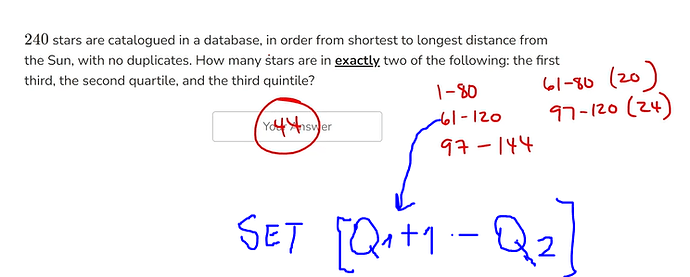
Another example regarding my doubt is question 13 of Data Analysis Fundamentals Quiz #2:
As you can see, in the solution of this question the way the 4 groups divided by the quartiles are formed is different than the method in the first question I posted, as the second group does include the median.
In this question the second quartile goes from 61 (Q1+1) to 120 (Q2). So I get the groups would be as follows:
1st group: [L-Q1]
2nd group: ]Q1-Q2/M]
3rd group: ]Q2/M-Q3]
4th group: ]Q3-G]


