In GRE, if we find figures similar to ones as shown above, is it reasonable to assume symmetry without looking too closely?
What kind of symmetry?
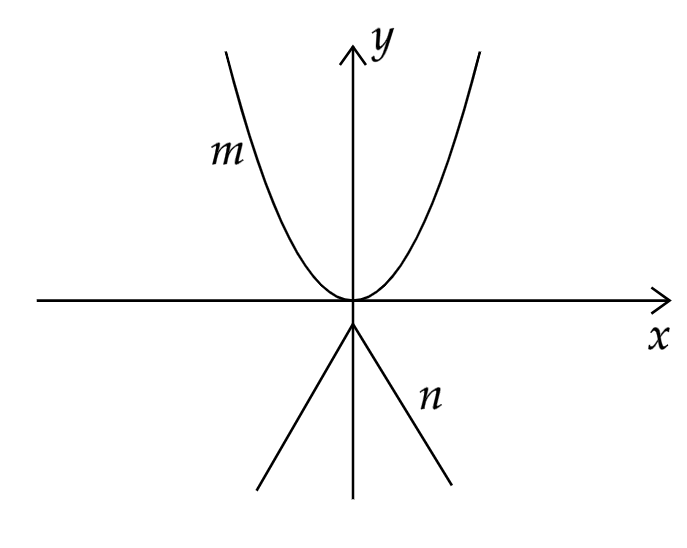
In figure 1, the lines m and n seem symmetric around the y-axis.
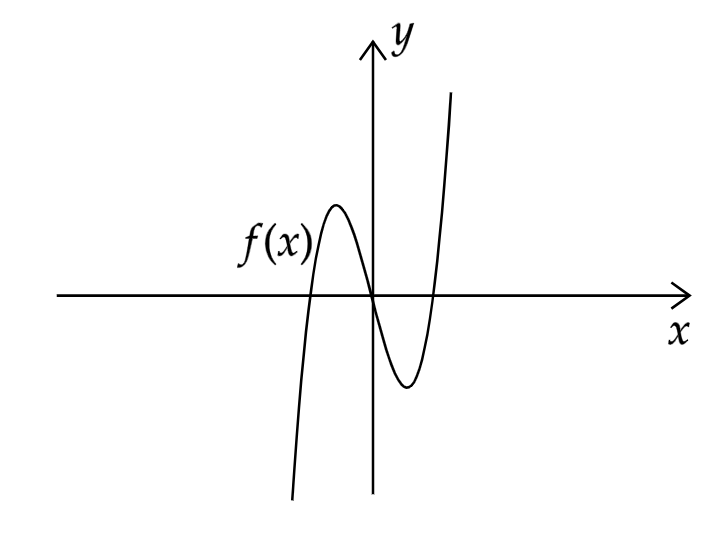
If figure 2, the line f(x) seems to be symmetric around the origin.
I just eyeballed this info. without looking closely. I am assuming that, in the GRE, they are considered to be drawn to scale. Am I right?
Figures m and n are symmetric about the y axis in your case. However, the cubic need not be symmetric about the origin; we only definitively know that it passes through the origin.
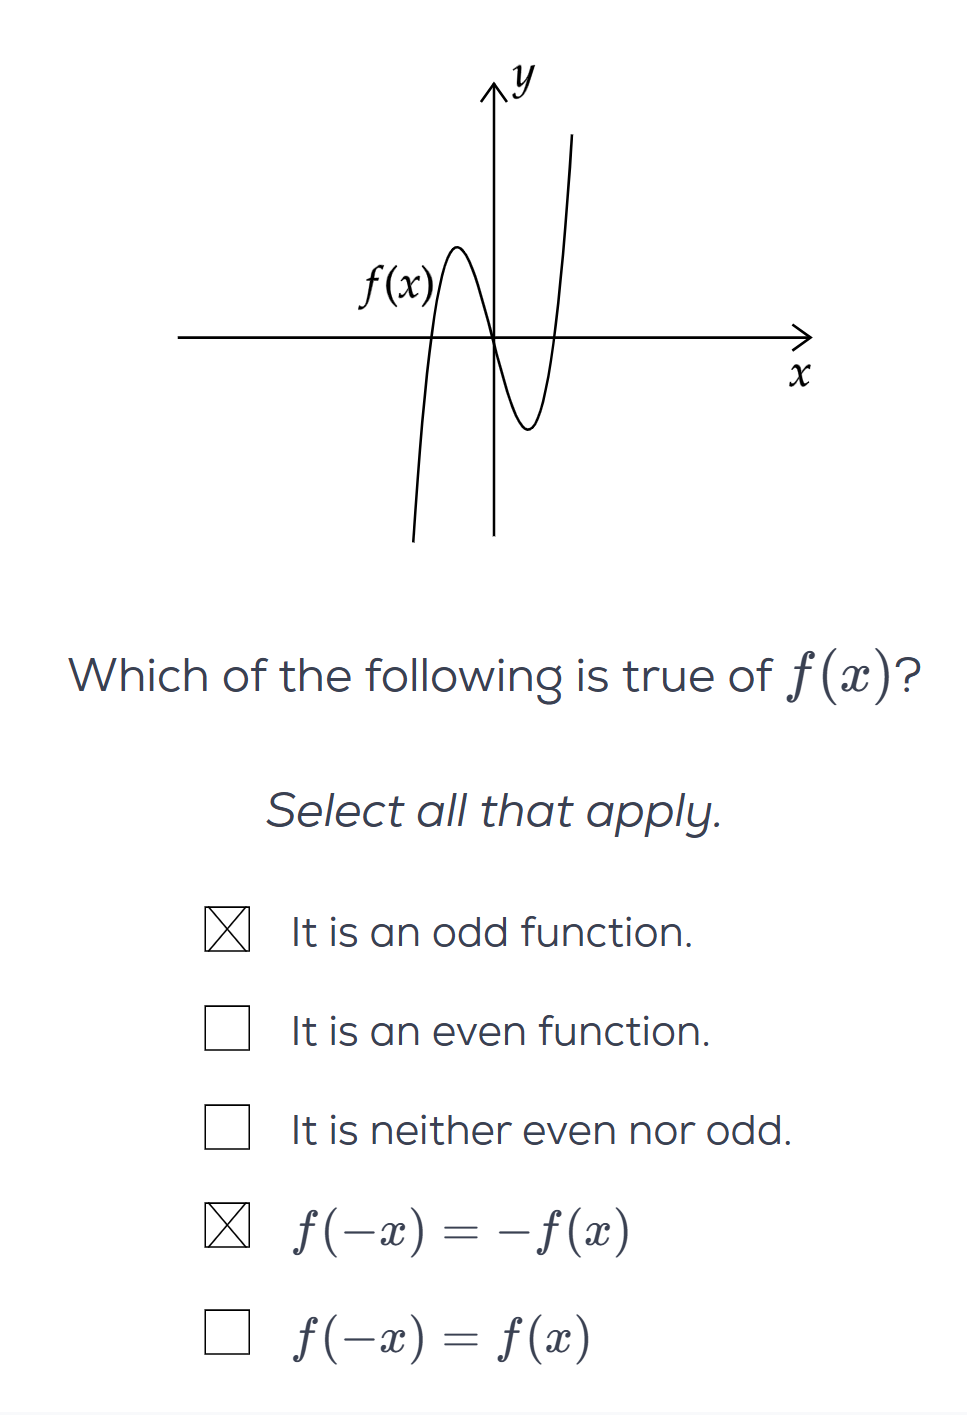
This was the question.
In my opinion, we can’t solve it without assuming that f(x) is symmetric to the origin. Ideally, none of them must be true as we can’t infer, with 100% certainity, that the function is symmetric.
If we’re being pedantic about it, then sure you’re right. I would, however, say that sometimes it’s better to interpret a question in light of its context instead of accepting it literally. If you really think about it, you’ll realize that the question is testing you on your understanding of even/odd functions. Essentially, if you claim that a function is odd, then whenever (x,y) is on the graph, (-x,-y) is also on the graph.
Coming back to your question, you might argue that the function looks odd but could fail at one isolated point; that’s technically correct, but it misses the question’s intent. In fact, if you apply this reasoning to other problems, you could always introduce small measurement uncertainty or noise when fitting an equation to the curve, and thus be technically correct in answering “neither even nor odd” for every question of this kind.
Another example could be something like the following:
Find the next term in the sequence 2,5,8, 11,....
Technically, the next term could be anything, but going off the theme implied by the question, the intended answer is likely 14.
So yeah — I would naturally interpret f(x) as being symmetric about the origin (as visually evident) and not worry too much about possible edge cases.
Yeah, I guess I am just trying to figure out whether GRE would be that pedantic about it, assuming that similarly graphed figures and questions appear in the GRE.
In the GMAT Data Sufficiency, if only this sequence is given and nothing else, it would be considered insufficient. The question must give some kind of indication that the numbers are evenly spaced or there must be some other difference or ratio between each element for it to be sufficient.
I guess those old GMAT habits are coming back to haunt me.
No, because as mentioned, it defeats the point of the question. You could always claim that there exists a point that doesn’t follow the symmetric relation, and therefore the answer would always be “neither even nor odd”. In your case, that would mean that the graph of M is “neither even nor odd,” because who’s to say that (3,5) truly matches with (-3,5)? From the visuals, it could just as well be (-2.9995, 5). The same situation would arise with the graph of N. and virtually with any question of this kind, so I guess it ends up being a rather silly scenario to worry about altogether.
I mean when someone actually asks you to “find (compute) the next term” as opposed to a QC or Data sufficiency question. In which case, you’d likely answer 14 instead of something random like 205, even though both could technically be correct depending on the interpolation.
Anyway, I’m inclined to believe that there won’t be an official question of this kind, because their conventions don’t directly address such cases—just like how their box plot conventions don’t explicitly specify whether outliers are plotted. If they do, I’d personally opt for the most natural interpretation.
1 Like