In all the mocks I’ve given so far, there is always a section based on data interpretation questions - such as given a chart of some kind, there are 3-4 questions on various parts of the chart, ex. % increase/decrease for category A vs category B over year X and year Y, etc.
I couldn’t find any such lesson/videos and quizzes in PrepSwift. The only two related lessons I found are - Ways to Present Data I - PrepSwift and Ways to Present Data II - PrepSwift. Both these lessons just describe the various ways such information can appear on the exam (charts, tables, graphs, etc). But there are no actual problems in these videos.
Likewise with the associated quizzes - PrepSwift: Ways to Present Data I - GregMat , PrepSwift: Ways to Present Data II - GregMat
Am I missing something, or are there no such problems?
PrepSwift does not include dedicated chart questions, no. The concepts needed for these chart questions are covered in other lessons (such as percentage change).
Are there chart questions covered in other plans? The I’m overwhelmed or 2-month plan for example? It’s really strange that these questions are not covered. There’s a lot more to solving these questions than just the underlying concepts (ex. percent change), such as how to quickly read various types of charts, how to understand tricky questions framed in a way to trip you up, etc.
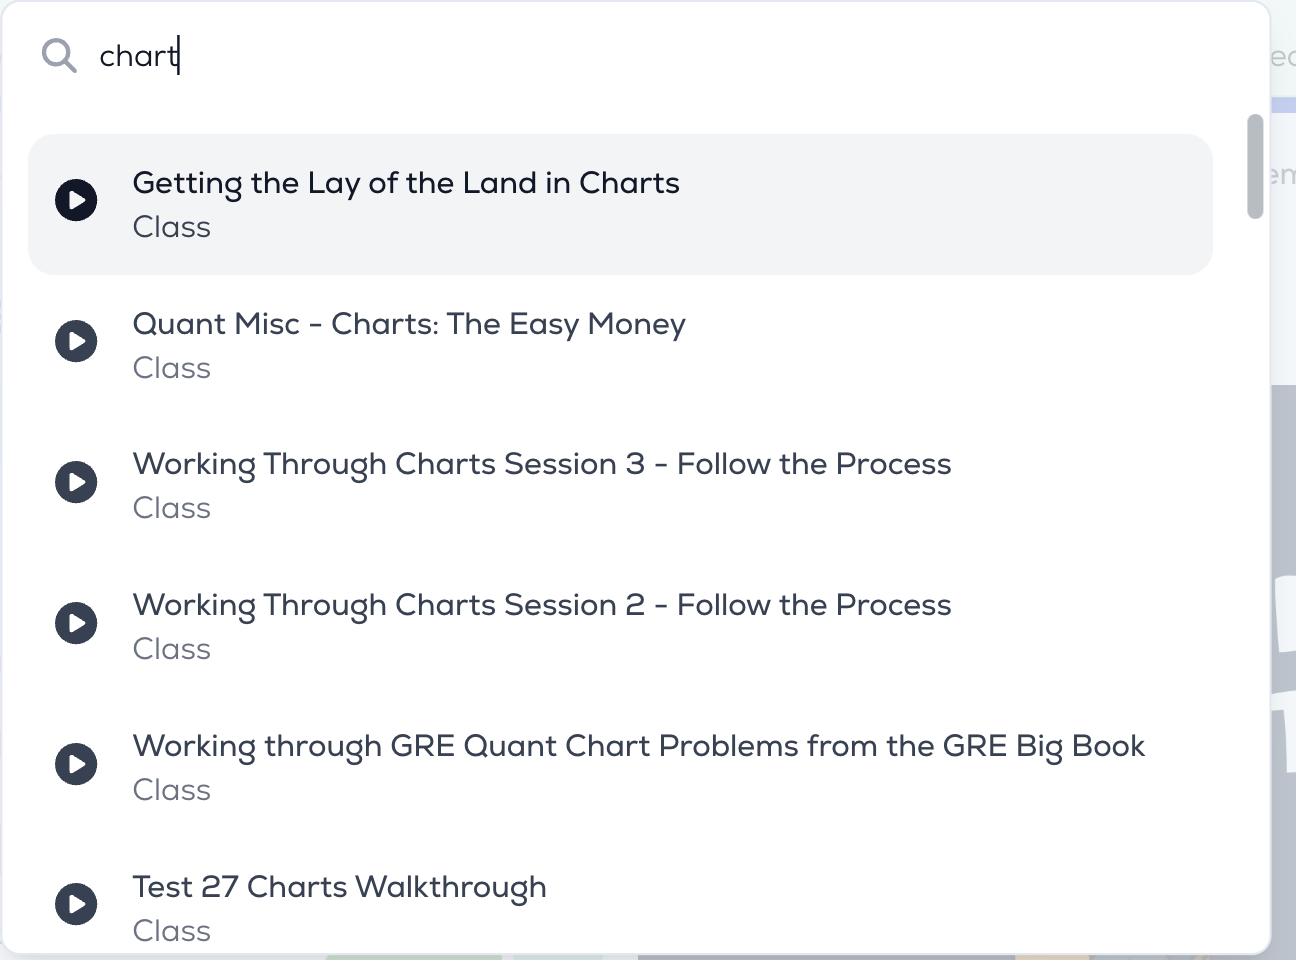
I think the 1/2-month plans do cover charts explicitly, and you can find many videos covering it on our main site (just use our search tool for something like Charts). The I’m Overwhelmed Plan uses PrepSwift and hence won’t cover charts either.
That being said, we should indeed add a couple of videos that explain how to solve chart problems in PrepSwift (@gregmat for reference).
You can find videos that specifically cover charts strategy by searching “chart” in the searchbox:
I also recommend the Old GRE Walkthrough videos for charts: Course - GregMat